This study aimed to aid in problem-solving for data challenges by means of analysing the risk of reverse-engineering and attribution, providing a methodology to measure the identifiability of synthetic data and data synthesis algorithms, and providing recommendations to hedge the risks of re-identification while maintaining data utility.
Authors: Ninda Khoirunnisa / Efua Kamara / Yasmine Khalifa / Max Wang / Syafiqah Azman. This is a final project for Applying Data Science Course in MSc Data Science Program, The University of Manchester, 2023
Introduction
Synthetic data is information that has been created using a mathematical framework or programme that was created with the intention to address a (number of) data science tasks (Jordon et al., 2022). Across a variety of fields, synthetic data is employed as a solution to confidential information release, data de-biasing and equality, and data augmentation for durability amongst other use cases.
Methods for creating Synthetic data from real data include creating data based on multivariate distributions of the original data, fitting a model to the real data and then using that model to build the synthetic data, and employing deep learning methods (e.g., variational autoencoders (VAE) or generative adversarial networks (GAN)); Bowen, and Liu (2020).
An identifiable individual in a dataset is an individual that can be located, either directly or indirectly, using a host of variables that are specific to their biological, genetic, psychological, financial, cultural, or social identities (Yoon et al., 2020). In this report we present: an efficient method to assess reidentification and attribution risk in synthetic data, and a variety of suggestions for reducing the risks of re-identification to a sufficiently remote level.
Literature Review
Re-identification, Attribution, and Attribution Risk
Re-identification, or identity disclosure, is achieved when the anonymized dataset can be linked to external information about the same population and (in the case of an external dataset being utilised) uses quasi-identifiers to link variables across datasets (Domingo-Ferrer, 2009). Examples of quasi-identifiers are age, sex, occupation, location, and marital status. These can be used to pinpoint an individual to their data points in the dataset. For example, if an individual has multiple highly identifiable attributes within the context of the dataset (i.e., presence of a rare disease in a relatively unpopulated postcode/location), an intruder may be more able to identify them, although not with great certainty (Taub et al., 2018). The risk of attribution can be measured in different ways, as discussed in the following section.
Attribution occurs when a certain attribute or characteristic is inferentially linked to a population segment (Taub et al., 2018). A correct attribution is when an attribute is correctly identified for an individual in the dataset (Shlomo, 2018). Attribution and re-identification may occur simultaneously or independently of one another, wherein the target information is revealed about a group or segment instead of a specific individual (ibid.). This report focuses on attribution as re-identification is not a concern for fully synthetic data considering that the keys of non-target variables do not map onto each other (Taub et al., 2018).
According to Domingo-Ferrer (2009), attribution risk rises when synthetic datasets show new information to the attacker that is sensitive or protected. He also agrees with Duncan et al (2004) regarding the data linkage risk, specifying that the external data source must comprise explicit or implicit identifiers (that are absent from the protected dataset), the former of which include names and identification numbers, and the latter including IP addresses and device serial numbers.
Testing the Identifiability of Synthetic Data
Utility, Fidelity, and Privacy of Synthetic Data
Utility
Synthetic data ought to be both comparable to and distinct from the actual data in order to be significant. Issues will arise when synthetic data is overly similar to genuine data. The “permitted” likeness (or the needed difference) will vary from job to job and represents a single of the three attributes – utility, privacy and fidelity – that are essential to the synthesis of synthetic data. Synthetic data’s utility is frequently assessed by how well it performs a certain goal or collection of activities. Comparing the efficiency of algorithms trained on actual data with that of algorithms trained on synthetic data may entail evaluating specific measures like precision, accuracy, and model impartiality characteristics like demographic equality, impartiality via ignorance, or alternatively conditional impartiality (van Breugel, Kyono, Berrevoets, and van der Schaar, 2021). The Training on Synthetic, testing on actual method, wherein algorithms are taught using synthetic data whilst their efficiency is then assessed on actual data, is frequently needed to do this.
Fidelity
Although frequently grouped alongside utility, Jordon et al (2022) separate fidelity and describe it as measurements that directly contrast the synthetic data and actual data (as opposed to comparing them indirectly via an algorithm or via effectiveness on a particular assignment). The degree to which the synthetic dataset “statistically” resembles the genuine information is known as fidelity at an advanced stage of analysis. Complete statistical resemblance or mirroring the variances between the real and synthetic data, must, in the most broadly applicable scenario, permit many activities that might be conducted on the actual data to be executed with the synthetic. Yet this kind of match is challenging (particularly when there are privacy concerns) and may be potentially unfavourable when biases exist.
Although not identical nor fully connected, utility and fidelity are inextricably linked. In certain instances, utility may be increased whilst fidelity is decreased (and vice versa), thereby making room for additional advantages, such increased privacy.
Privacy
The level of detail synthetic data discloses regarding the original data from which it was created determines how private it is. There may be varying privacy protections needed based on the usage scenario. For instance, less rigorous privacy review is often required for in-house synthetic data distribution inside a safe setting compared to data given to the wider population. There are theoretically solid ideas like differential privacy which provide a thorough examination for the privacy of methods utilised to create synthetic data.
Synthetic data’s privacy reduces as fidelity improves. In light of this, it is often not viable to provide private synthetic data which are beneficial across all use scenarios. Alternatively, one may create many synthetic data, all of which have chosen privacy assurances, and arrange prospective scenarios for use according to the level of fidelity deemed necessary (meaning what components of the actual dataset are necessary to have represented within the synthetic dataset) (Jordon et al., 2022).
Measurement - Weighted Euclidean Distance
Three key levels of identifiability exist: First, direct identifiers (identifiable data) such as complete names or distinctive identification numbers; indirect identifiers (potentially identifiable data) which include information that might be used to re-identify a person in the context of other information; and finally, non-identifiable information, such as the outcomes of physiological and laboratory tests. The measurement of identifiability must take this into consideration (Kikuchi et al., 2016).
In an attempt to de-identify the actual dataset, the synthetic data must be sufficiently distinct (Wang, Blei, and Cunningham, 2021). The smallest difference between the original and synthetic data will serve as the gauge for whether they are sufficiently distinct. Since certain characteristics or qualities are more uncommon than others, they are easier to identify the individual from. For this reason, Euclidean distance needs to be weighted, such that, for instance, the difference between males and females should be nearer than the gap between cancer and non-cancer sufferers. Having cancer has a higher weight than not having it since it is more uncommon and hence easier to identify (Kikuchi et al., 2016). Due to this, we utilise the weighted Euclidean distance as the metric to determine how far apart two individuals’ information are from one another in regard to identifiability.
From this we take that identifiability (∈) means, there must be fewer than ∈ ratio data points from the actual dataset (D) inside the synthetic dataset (𝐷̂) which are not sufficiently dissimilar from the actual data. Equation 1 shows 𝑟𝑖′𝑠 mathematical definition.
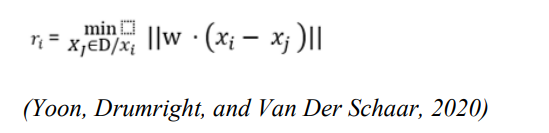
The weight parameter of the Weighted Euclidean distance is represented by ‘W’ and D/xi is the dataset D without xi. The smallest possible separation between xi and the remaining actual data in D is represented by 𝑟𝑖 . The cut-off for “sufficiently distinct” might vary depending on what was observed. This is how sufficiently dissimilar for the data xi is. An outlier’s sufficiently distinct ought to be significantly bigger (in regard to proximity) for de-identification 𝑟̂𝑖 is defined as:
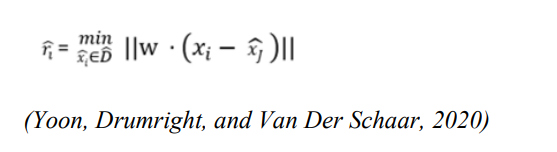
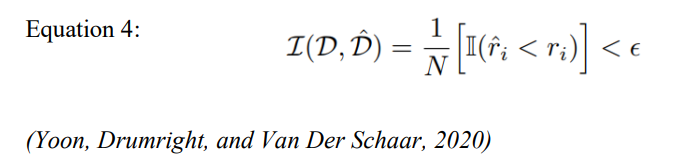
The smallest gap between 𝑥𝑖 to the constructed data in 𝐷̂ is 𝑟̂𝑖 . Equation 2 represents identifiability (∈) through the use of 𝑟𝑖 and 𝑟̂𝑖. If Equation 3 holds then 𝐷̂ is identifiable from 𝐷 and the identity expression is represented by 𝕀, 𝑟𝑖 and 𝑟̂𝑖 are equation 1 and 2 respectively. For every data point in D, identifiability is the likelihood of the proximity being nearer to the nearest synthetic data (not sufficiently distinct) than the gap between the nearest actual data, is smaller than ∈ . Meaning ≥ 1−∈ is the percentage of people who cannot be identified by synthetic data since its sufficiently dissimilar from actual data (Yoon, Drumright, and Van Der Schaar, 2020). Therefore, a dataset with an identifiability score of 1 would be completely identifiable, whereas completely non identifiable dataset would have an identifiability score of 0. The suggested identifiability is established for all datasets and is assessed differently for each. For the identifiability of every characteristic, the weight vector may be directly determined. Here discrete entropy is used, the suggested framework is flexible enough to accommodate various weight definitions.
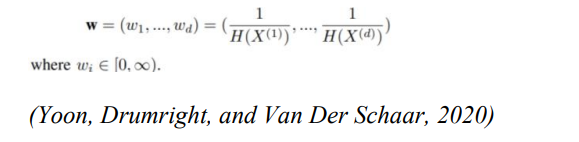
The weight vector may be assigned according to the subject matter understanding concerning the identifiability per characteristic. As an example, wi = 0 can be assigned for non-identifying information, like a biochemical result, and wi = 1 to identifiable characteristics, like a medical condition. However, the discrete entropy is used in this study as a representation of the weight vector, the suggested structure is flexible enough to accommodate various weights. The characteristics discrete entropy is stated in equation 4
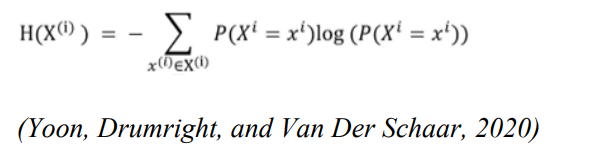
The i-th characteristic’s entropy is represented by H(X(i)). According to Bein (2006) Entropy is a measure of the characteristic’s ambiguity. The weights of identifiability ought to be the opposite of entropy as less ambiguity leads to better identifiability. As a result, the weight vector (w) associated with the weighted Euclidean distance measure is introduced below.
The primary goals in creating synthetic datasets are: Ensuring the datapoints from the dataset are spread similarly to the ones in the actual dataset, and to ensure the datapoints are adequately dissimilar compared to the actual datapoints this difference may be calculated through identifiability (in which, Identifiability ∈ [0, 1]) (Göbel et al., 2020). It is crucial to understand a trade-off exists with both of these goals: avoiding re-identification through restricting data on the actual individuals whilst transferring enough information regarding the makeup of the actual dataset to provide machine learning techniques to be trained on the synthetic data to mimic the actual data. The minimax optimisation issue is used to formalise this in equation 6.
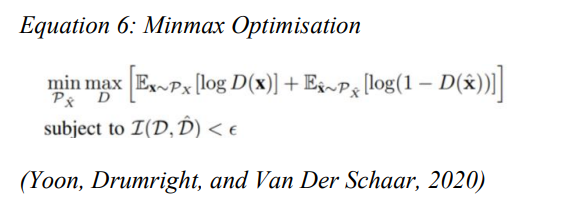
The user-selected identifiability criterion is > 0. The discriminator (D) seeks to discriminate across datapoints from the actual data (PX) versus the synthetic data (PX). Conversely, the tool (PX) attempts to produce synthetic data to ensure the discriminator is unable to differentiate the produced data apart from the real data. The precision of this discriminator in accurately classifying the actual and produced data may be defined by the objective function in greater detail. This level of precision is expressed as the minimax optimisation issue, where the discriminator seeks to maximise precision and the producer function seeks to minimise precision. The identifiability requirement I(D, D) is concurrently met (Yoon, Drumright, and Van Der Schaar, 2020).
A popular anonymity notion is called k-Anonymity. When it is impossible to discriminate between the individual’s data and the data of at least k-1 other people whose data also exists in the dataset, it satisfies the k-anonymity condition. Due to the identifiability concept established in this research, ADS-GAN may be seen as producing synthetic datasets that satisfy the 2-anonymity condition, since it generates at least 2 comparable data points surrounding each created synthetic data point. When it comes to ADS-GAN, similarity is characterized to be the k-Anonymity description’s equivalent of being unidentifiable (Sweeney, 2002).
Recommendations for mitigating the risks of re-identification
Generative Adversarial Networks
The previous methods are mainly used for generating realistic synthetic data step by step and sometimes manually, which can be challenging. An alternative approach to generating synthetic data programmatically is Generative Adversarial Network, GAN, an example of a generative model (Goodfellow, 2014). Its advantages include simplistic testing manipulating high-dimensional probability distributions; it can be incorporated into reinforcement learning in several ways; models can be trained with missing data and provide predictions on inputs for missing data; and it enables machine learning to work with multi-modal outputs. The foundation of GAN is the existence of a generator and discriminator, both trained in an adversarial fashion against each other (Yoon. 2020). The generator attempts to generate synthetic data points that the discriminator is incapable of distinguishing, and the discriminator tries to identify which of the data points are synthetic. Although GAN models are useful in creating synthetic data, they face some challenges (Yoon, 2020). One of the challenges is the converged generator only generates similar samples, called mode collapse. Another is the training procedures of the generator and discriminator are unstable because the two components are adversarially trained. As mentioned by Jin (2020), there are two distinguishing advantages of GANs. Firstly, it does not rely on any prior assumption about the distribution of the data. This is required for many traditional methods that use maximum likelihood to estimate data distribution, which makes it simpler and more varied. Secondly, GANs generate realistic samples by using a generator to forward propagate deceptive data, which is a straightforward process, unlike traditional sampling methods which can be complex.
Data Sources and Methodology
Dataset
Pima is a group of Native Americans who live in Arizona. Due to its genetic predisposition, this group survives a diet poor of carbohydrates for years but because of a sudden change from traditional agriculture to processed food, along with decreasing in physical activity, Pima developed the highest prevalence of diabetes type 2, and it made them the subject of many studies recently. The dataset used in this study contains 768 individual observations of women from Pima group.
British Social Attitudes Survey (BSA) (2014) consists of 2878 records; each record has a total of 726 columns. This study used the original BSA and due to its big size, which will affect the time needed to generate synthetic data, only a few columns were selected. Following the research by Taub (2020), all variables being used are the key variables: GOR, education, qualification, marital status, age, gender, social class, and household income. The target variable from this dataset is the banded income.
Synthetic Data Creation
Several GAN-based methodologies have been proposed to generate synthetic datasets, such as medGAN (Choi et al., 2017), differentially private GAN or DPGAN (Xie et al., 2018), private aggregation of teaches ensembles or PATE-GAN (Jordon et al., 2019), and ADS-GAN (Yoon, 2020). In research conducted by Yoon (2020), the synthetic data of two datasets generated by several GAN-based frameworks were compared in terms of their identifiability levels such as Jensen-Shannon Divergence (JSD) and Wasserstein distance and ADS-GAN was proven to perform better than the other benchmarks thus ADS-GAN will be used in this study to generate synthetic data of Pima Dataset and BSA dataset.
Synthcity is an open-source software package that can be used to generate synthetic data and evaluate the fidelity, utility, and privacy of generated data by using a large set of metrics such as Jensen-Shannon distance and Wasserstein distance for the fidelity aspect; Linear model, MLP, and XGBoost for the utility aspect; and k-anonymity, identifiability score by using weighted Euclidean distance, and l-diversity for the privacy aspect (Qian et al., 2023).
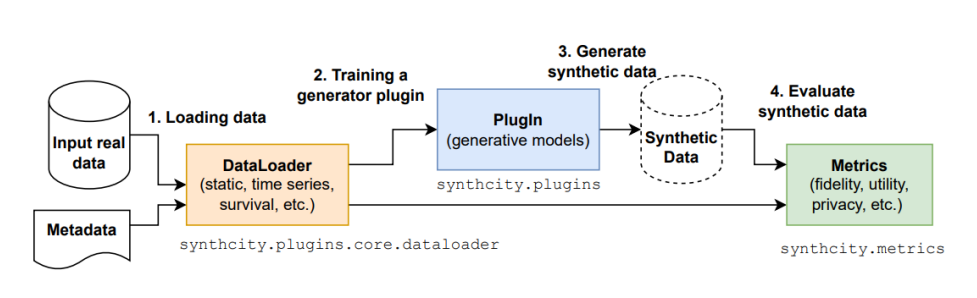
Figure 1. Workflow of generating and evaluating synthetic data with synthcity (Qian et al., 2023)
Synthcity was used in this study to generate synthetic data from Pima dataset and BSA dataset. The workflow of Synthcity follows the steps that was shown in Figure 5.1 (Qian et al., 2023).
-
Load the dataset with GenericDataLoader: GenericDataLoader is a class that can be used to load and store various types of input data such as tabular, time series, and survival data (Qian et al., 2023). To load the data from the Pima dataset, the missing values in this dataset need to be imputed with additional tools or techniques because currently Synthcity does not support training and generation of data with missingness (Qian et al., 2023). Besides that, pre-processing steps such as encoding and standardization are not needed because according to Qian et al. (2023), these processes are handled by Synthcity internally.
-
Train the generator with Plugin: Each Plugin in synthcity represents a specific generation algorithm (Qian et al., 2023). There are several choices of algorithms that are differed by their purpose, e.g., CTGAN and Bayesian Network for general purpose; ADS-GAN, PATE-GAN, and DP-GAN for privacy-focused; RadialGAN for domain adaptation; SurvivalGAN and SurvivalCTGAN for static survival analysis; TimeGAN and FourierFlows for time-series and time-series survival analysis; ImageCGAN and ImageADS-GAN for images data.
-
Generate the synthetic data: The creation of synthetic data can be done after the Plugin has been trained. Synthcity supports standard data generation which is the most basic generation task where certain distributional distances between data from the original and synthetic dataset are minimised (Qian et al., 2023). ADS-GAN which was used to generate synthetic data falls into methods that was designed to defend against specific attacks, such as membership inference, attribute inference, and re-identification (Shokri et al., 2017, Kosinski et al., 2013, Dinur and Nissim, 2003).
-
Evaluate the synthetic data: Synthcity provides various metrics to evaluate the fidelity, utility, and privacy of synthetic data (Qian et al., 2023). The evaluation of the dataset will help to determine whether the generated synthetic dataset is what was aimed for as the values will indicate the similarity and the differences from the original data.
In this study, a 14-minute process is done to train the generator for a small dataset such as the Pima dataset, meanwhile for a bigger dataset such as BSA the training process of the generator took up to 39 minutes. Besides standard data generation, ADS-GAN also supports generating conditioned synthetic data by the target variable (y) after the training process is done. This method can be applied to control the output of the generator thus some problems such as biased data in the Pima dataset where a class is more likely to be found in a dataset can be solved.
As mentioned in Section 2, ADS-GAN uses lambda identifiability penalty (𝜆) as a parameter to control the privacy or identifiability level. In its default setting, the value of this parameter was 0.1. If the (𝜆) is high, the method penalized more on the identifiability loss so with large (𝜆) the corresponding identifiability would be small.
Experimental Results
Marginal Distribution
Synthcity provides a method to visualise the comparison of marginal distribution between original data and synthetic data by using Jensen-Shannon Divergence (JSD) as the evaluator (Qian et al., 2023). The JSD for each feature differs from 0.01 and 0.02. According to Yoon (2020), the lower score indicates that the synthetic data preserve the distribution of the original data (if the distribution is exactly the same, JSD will be 0). Figure 5.4 and 5.5 shows how similar the marginal distribution of original and synthetic data of the Pima and BSA dataset that were plotted in a bar chart is. Besides the bar plot, Synthcity also provides a method to plot the t-SNE that sets the number of components to 2 as the default as shown in Figure 5.2 and Figure 5.3. This method reduces the dimension of the dataset by using Principal Component Analysis (PCA).
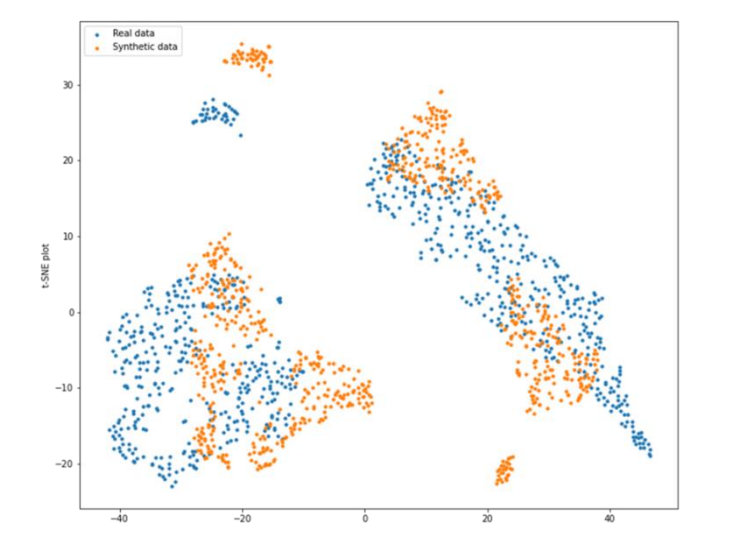
Figure 2. t-SNE of Pima dataset (n_components = 2)
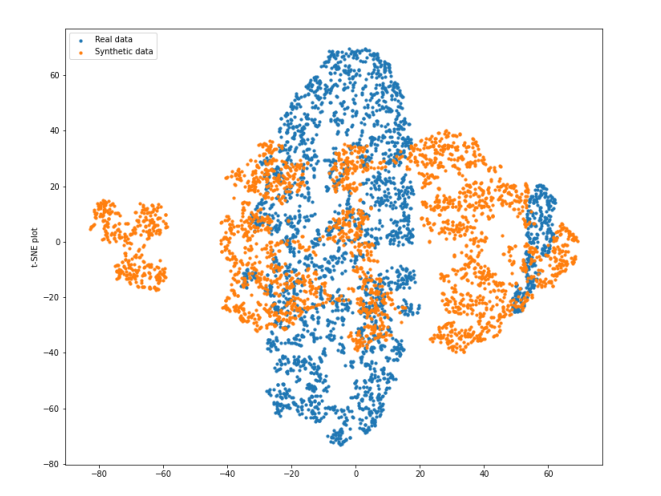
Figure 3. t-SNE of BSA dataset (n_components = 2)
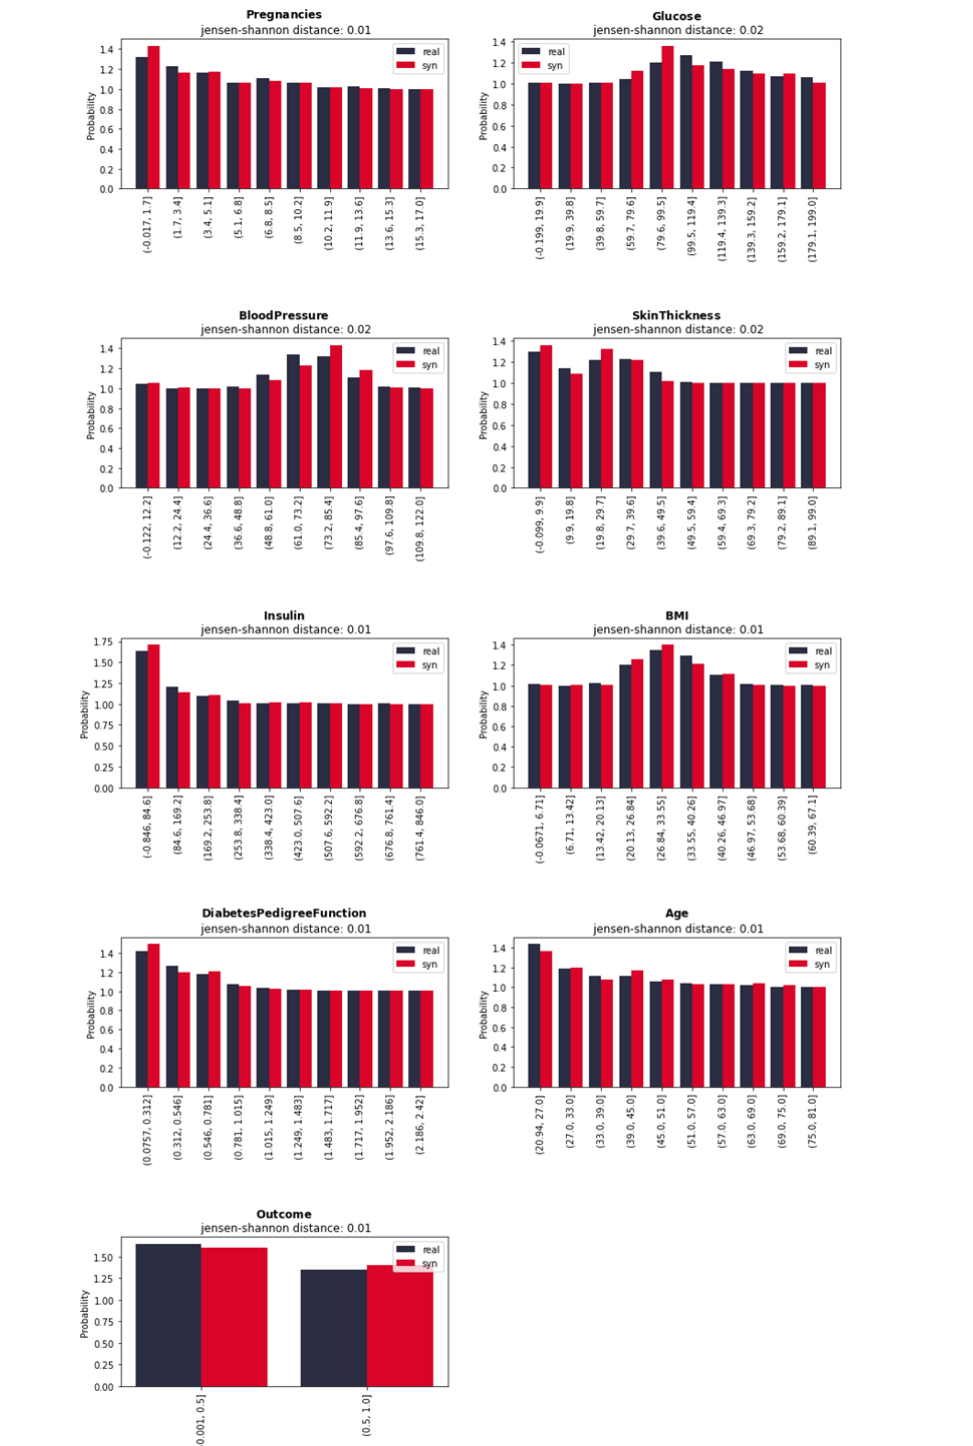
Figure 4. Marginal distribution comparison between original and synthetic data of Pima dataset
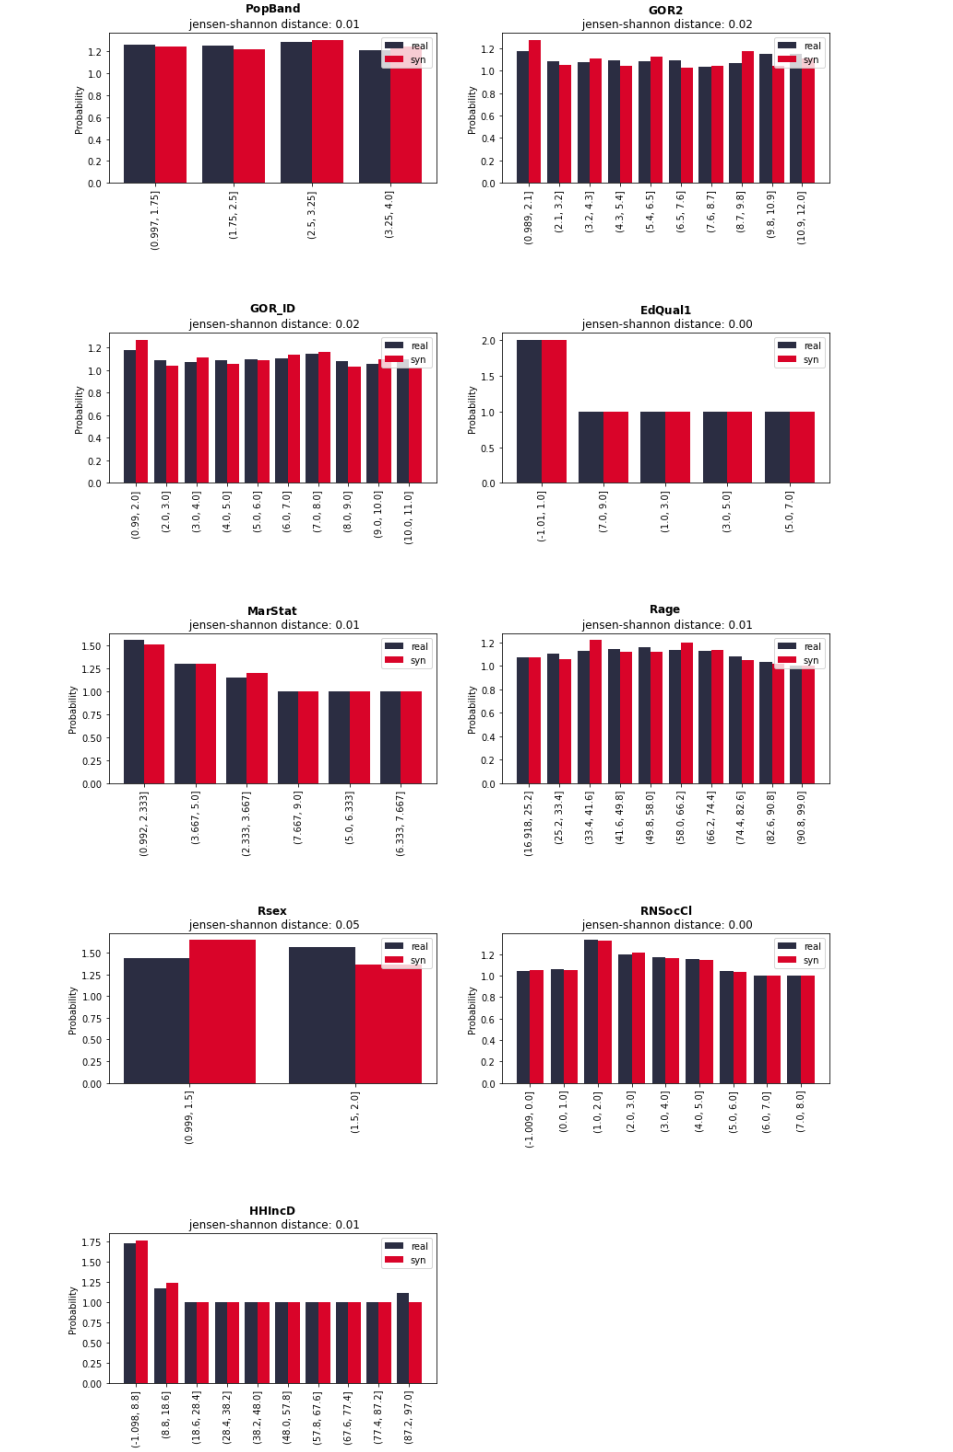
Figure 5. Marginal distribution comparison between original and synthetic data of BSA dataset
Re-identifiability
Re-identifiability of synthetic data falls below the privacy metrics category in Synthcity. The re-identifiability of synthetic data of both datasets can be measured by passing ‘identifiability_score’ as metrics privacy value. The identifiability score of Pima and BSA dataset are shown in Figure 6 and 7 respectively.
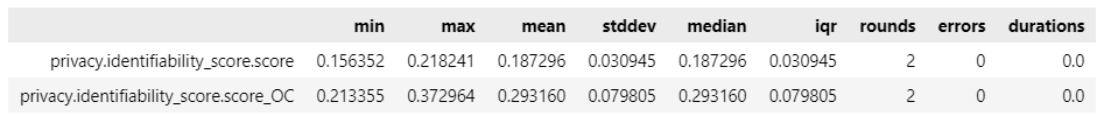
Figure 4. Identifiability score of Pima synthetic data
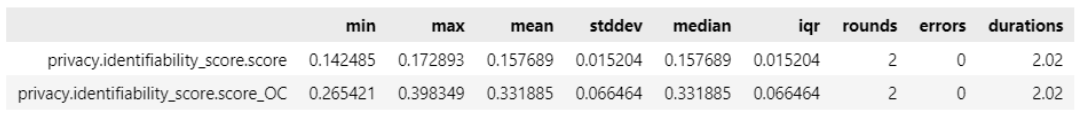
Figure 5. Identifiability score of BSA synthetic data
Synthcity estimates the risk of re-identifying any real data point using synthetic data by following the formula that was proposed by Yoon (2020). High identifiability score indicates that the synthetic data are very close to the original data thus the risk of re-identification is high. Figures 6 and 7 shown above indicates good margins of identifiability values which proves that the method use which is ADS-GAN lowers the risk of re-identification of the synthetic data.
Discussion
Based on the results that have been achieved in figure above, it can be seen that the value for Wasserstein Distance and Jensen-Shannon Divergence (JSD) showed very small margins all with value less than 0.15 for all Wasserstein distance and JSD with less than 0.04. These mean that the joint distribution of the original dataset and the generated synthetic dataset proves to show similarity in terms of distribution. This is a good sign of synthetic data generation. According to Yoon (2020) JSD and Wasserstein distance metrics with lower values show that ADS-GAN maintains the joint distribution of the original data more effectively. In this context, we can say that the generation of synthetic data does preserve the original distribution of the dataset, making the value of Wasserstein distance and JSD to be small. In easier context to comprehend this matter, Wasserstein distance is the amount of work to move one distribution of a dataset to another. The better the similarity of distribution of original dataset and the synthetic dataset, the lessor the work which leads to lower value of Wasserstein’s distance.
Based on our analysis and findings, it is clear that there are many methods that can be implemented to ensure the anonymisation and reduce the risk of re-identification of synthetic data. ADS-GAN is proven to produce a good quality of synthetic data without jeopardising the identity of the subjects within the generated synthetic data. Overall, this proves that the method of generation brings a crucial impact on protecting privacy and identifiability of the subjects of a dataset.
Conclusions
Synthetic data are produced to avoid privacy breaches of the data subjects. There are many risks that should be considered when generating synthetic data, such as attribution, model inversion, and utility disclosure. Thus, balance is the key to generating a high utility while at the same time maintaining the privacy of the data.
Few methods have been suggested to reduce the risk of re-identification. The first one is SDC which consists of perturbative methods and non-perturbative methods. Most of the attributes are continuous for our chosen dataset, hence some perturbative methods such as micro aggregation, post-randomization, and additive noise are some of the suggested ways to reduce the risk of re-identification. The risk re-identification can also be reduced ignificantly when using the ADS-GAN to generate synthetic data.
Despite being able to produce a realistic synthetic dataset, quantifiable and mathematical definitions of identifiability such as Weighted Euclidean distance and Wasserstein were needed to ensure that the identifiability constraint was met. In the experiment with the Pima dataset and BSA dataset, ADS-GAN was proven to be able to produce low identifiability scores and similar joint distributions of data between the original and synthetic data.
References
-
Almasi, M.M., Siddiqui, T.R., Mohammed, N. and Hemmati, H. (2016). The Risk-Utility Tradeoff for Data Privacy Models. [online] IEEE Xplore. doi:https://doi.org/10.1109/NTMS.2016.7792481.
-
Bein, B., 2006. Entropy. Best Practice & Research Clinical Anaesthesiology, 20(1), pp.101-109. Bowen, C.M. and Liu, F., 2020. Comparative study of differentially private data synthesis methods.
-
Buolamwini, J., Gebru, T., Friedler, S. and Wilson, C. (2018). Gender Shades: Intersectional Accuracy Disparities in Commercial Gender Classification *. Proceedings of Machine Learning Research, [online] 81(1), pp.1–15. Available at: https://proceedings.mlr.press/v81/buolamwini18a/buolamwini18a.pdf [Accessed 2 May 2023].
-
Duncan G, Keller-McNulty S, Stokes L. Database Security and Confidentiality: Examining Disclosure Risk vs. Data Utility through the R-U Confidentiality Map. Los Alamos National Laboratory, NM: National Institute for Statistical Sciences; 2004.
-
Domingo-Ferrer, J. 2001, Disclosure Control Methods and Information Loss for Microdata Domingo-Ferrer, J. (2009). Disclosure Risk. Encyclopedia of Database Systems, pp.848–849. doi:https://doi.org/10.1007/978-0-387-39940-9_1506.
-
Dwork, C. (2011). Differential Privacy. In: V. Tilborg and S. Jajodia, eds., Encyclopedia of Cryptography and Security. Boston, Ma: Springer Us.
-
Fayyoumi, E. Oommen, B, 2010, A survey on statistical disclosure control and micro-aggregation techniques for secure statistical databases Fredrikson, M., Jha, S. and Ristenpart, T. (2015). Model Inversion Attacks That Exploit Confidence Information and Basic Countermeasures. In: I. Ray, N. Li and C. Kruegel , eds., Proceedings of the 22nd ACM SIGSAC Conference on Computer and Communications Security - CCS ’15. [online] ACM Press, pp.1322–1333. doi:https://doi.org/10.1145/2810103.2813677.
-
Göbel, T., Schäfer, T., Hachenberger, J., Türr, J. and Baier, H., 2020, January. A Novel Approach for Generating Synthetic Datasets for Digital Forensics. In IFIP Int. Conf. Digital Forensics (pp. 73-93).
-
Goodfellow, I. J., Pouget-Abadie, J., Mirza, M., Xu, B., Warde-Farley, D., Ozair, S., Courville, A., Bengio, Y., 2014b. Generative adversarial networks.
-
Hall, M. et al. (2022) A Systematic Study of Bias Amplification. Available at: https://arxiv.org/pdf/2201.11706.pdf (Accessed: 9 May 2023).
-
Jack W. Smith, J.E. Everhart, W.C. Dickson, W.C. Knowler, & R.S. Johannes. (1988). Using the ADAP Learning Algorithm to Forecast the Onset of Diabetes Mellitus. Annual Symposium on Computer Application in Medical Care, 261–265.
-
Jin L., Tan F., Jiang S., 2020, Generative Adversarial Network Technologies and Applications in Computer Vision, Comput Intell Neurosci, 1459107, doi: 10.1155/2020/1459107
-
Jordon, J., Szpruch, L., Houssiau, F., Bottarelli, M., Cherubin, G., Maple, C., Cohen, S.N. and Weller, A., 2022. Synthetic Data–what, why and how?. arXiv preprint arXiv:2205.03257.
-
Kikuchi, H., Yamaguchi, T., Hamada, K., Yamaoka, Y., Oguri, H. and Sakuma, J., 2016, March. Ice and fire: Quantifying the risk of re-identification and utility in data anonymization. In 2016 IEEE 30th International Conference on Advanced Information Networking and Applications (AINA) (pp. 1035-1042). IEEE.
-
Majeed, A. Lee, S, 2017, Anonymization Techniques for Privacy Preserving Data Publishing: A Comprehensive Survey
-
Qian, Z., Cebere, B.C. and van der Schaar, M., 2023. Synthcity: facilitating innovative use cases of synthetic data in different data modalities. arXiv preprint arXiv:2301.07573.
-
Shlomo, N. (2018) ‘Statistical Disclosure Limitation: New Directions and Challenges’, Journal of Privacy and Confidentiality, 8(1). Available at: https://doi.org/10.29012/jpc.684.
-
Shokri, R., Tech, C., Stronati, M. and Shmatikov, V. (2017). Membership Inference Attacks against Machine Learning Models. [online] Cornell University. Available at: https://arxiv.org/pdf/1610.05820.pdf [Accessed 2 May 2023].
-
Stock, P. and Cisse, M. (2017). ConvNets and ImageNet beyond Accuracy: Understanding Mistakes And Uncovering Biases. arXiv (Cornell University), 1(1). doi:https://doi.org/10.48550/arxiv.1711.11443.
-
Sweeney, L., 2002. k-anonymity: A model for protecting privacy. International journal of uncertainty, fuzziness and knowledge-based systems, 10(05), pp.557-570.
-
Taub, J. 2021, Synthetic Data: An Exploration of Data Utility and Disclosure Risk
-
Taub, J., Elliot, M., Pampaka, M. and Smith, D. (2018). Differential Correct Attribution Probability for Synthetic Data: an Exploration. Privacy in Statistical Databases, 11126, pp.122–137. doi:https://doi.org/10.1007/978-3-319-99771-1_9.
-
van Breugel, B., Kyono, T., Berrevoets, J. and van der Schaar, M., 2021. Decaf: Generating fair synthetic data using causally-aware generative networks. Advances in Neural Information Processing Systems, 34, pp.22221-22233.
-
Wang, Y., Blei, D. and Cunningham, J.P., 2021. Posterior collapse and latent variable non identifiability. Advances in Neural Information Processing Systems, 34, pp.5443-5455.
-
Wu, X., Fredrikson, M., Jha, S. and Naughton, J.F. (2016). A Methodology for Formalizing Model-Inversion Attacks. [online] IEEE Xplore. doi:https://doi.org/10.1109/CSF.2016.32.
-
Yoon, J., Drumright, L.N. and Van Der Schaar, M., 2020. Anonymization through data synthesis using generative adversarial networks (ads-gan). IEEE journal of biomedical and health informatics, 24(8), pp.2378-2388.
-
Desai, A., Freeman, C., Wang, Z., & Beaver, I. 2021. Timevae: A variational auto-encoder for multivariate time series generation. arXiv preprint arXiv:2111.08095., Chicago.
-
Fabius, O., & Van Amersfoort, J. R. 2014. Variational recurrent auto-encoders. arXiv preprint arXiv:1412.6581