A project to detect brain tumor by classifying MRI with CNN.
Author: Ninda Khoirunnisa. This is coursework for Statistic and Machine Learning II: AI, Complex Data, Computationally Intensive Statistics Course in MSc Data Science Program, University of Manchester, 2023.
Introduction
Brain tumor is a dangerous disease that can be found in children and adults. One of the ways to detect and identify this disease is by using Magnetic Resonance Imaging (MRI). Besides manual examination, machine learning and artificial intelligence can be used to classify the MRI.
Research Method
Dataset This study proposes a Convolutional Neural Network (CNN) that was trained by using a dataset of 3.264 MRI (Chakravarty et. al., 2021). This dataset contains 926 images of brain with glioma tumor, 937 meningioma tumor, 901 pituitary tumor, and 500 no tumor.
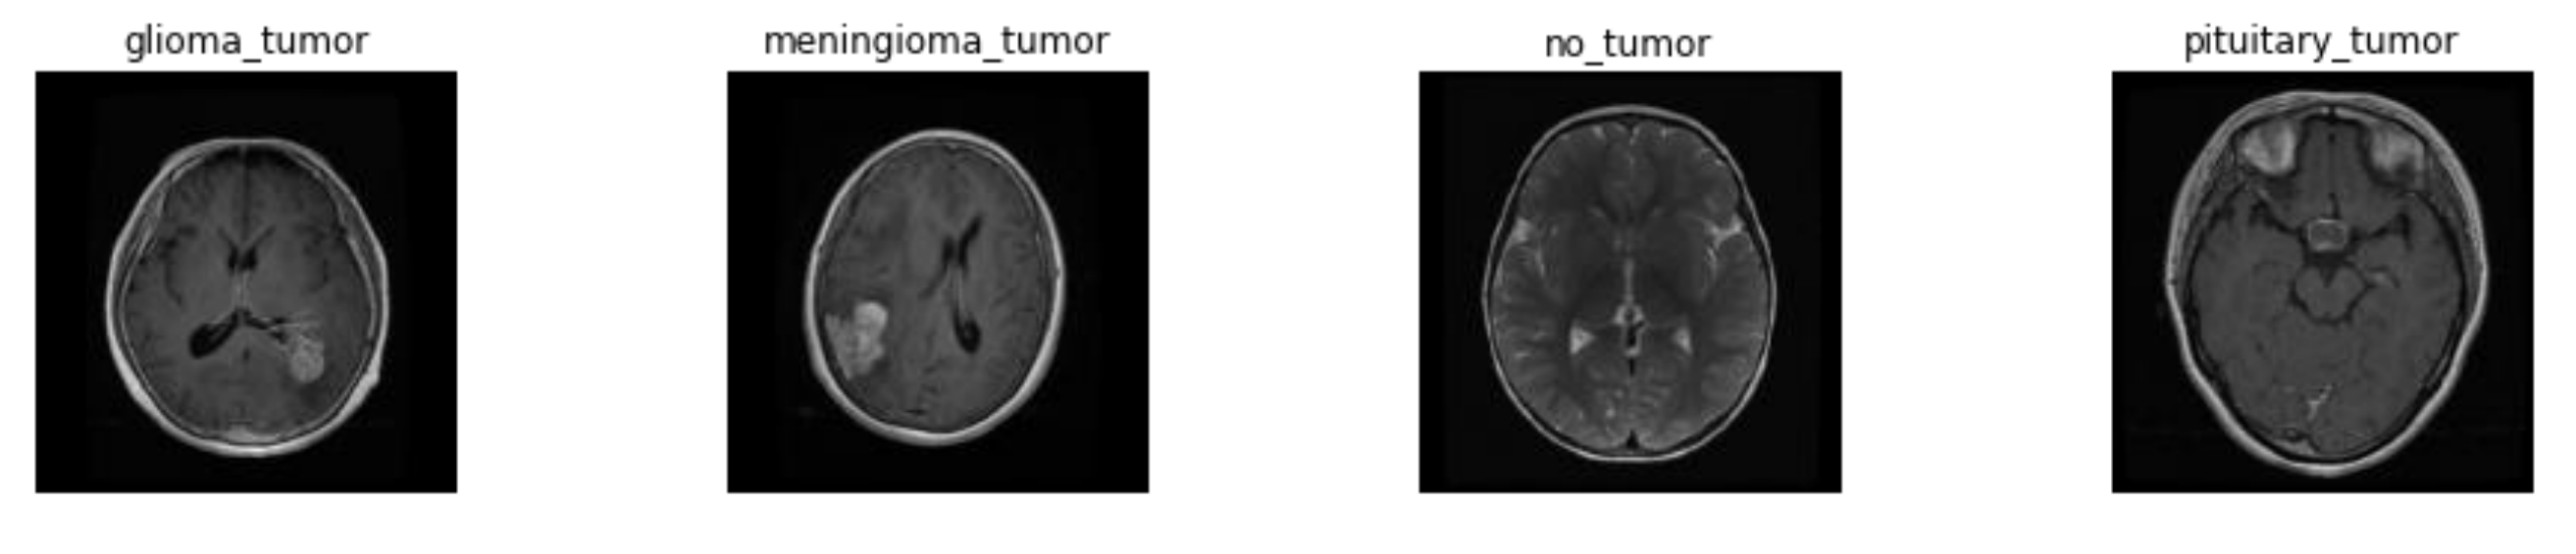
Figure 1. Example of images
Data Preprocessing and Augmentation The images on the dataset differ in size so in the preprocessing stage all images’ sizes and dimensions are transformed to 128 x 128 pixels (Minarno, 2021). After combining images from 2 folders in the original dataset, the dataset is split into 80% train data, 10% validation data, and 10% test data. Besides data preprocessing, augmentation produces extra data from existing data using rotation, zoom, shift, and flip techniques as shown in Figure 2.2. This method could improve the evaluation result of the classification (Xiao, 2020) and it is relevant for small datasets (Ottoni, 2023).
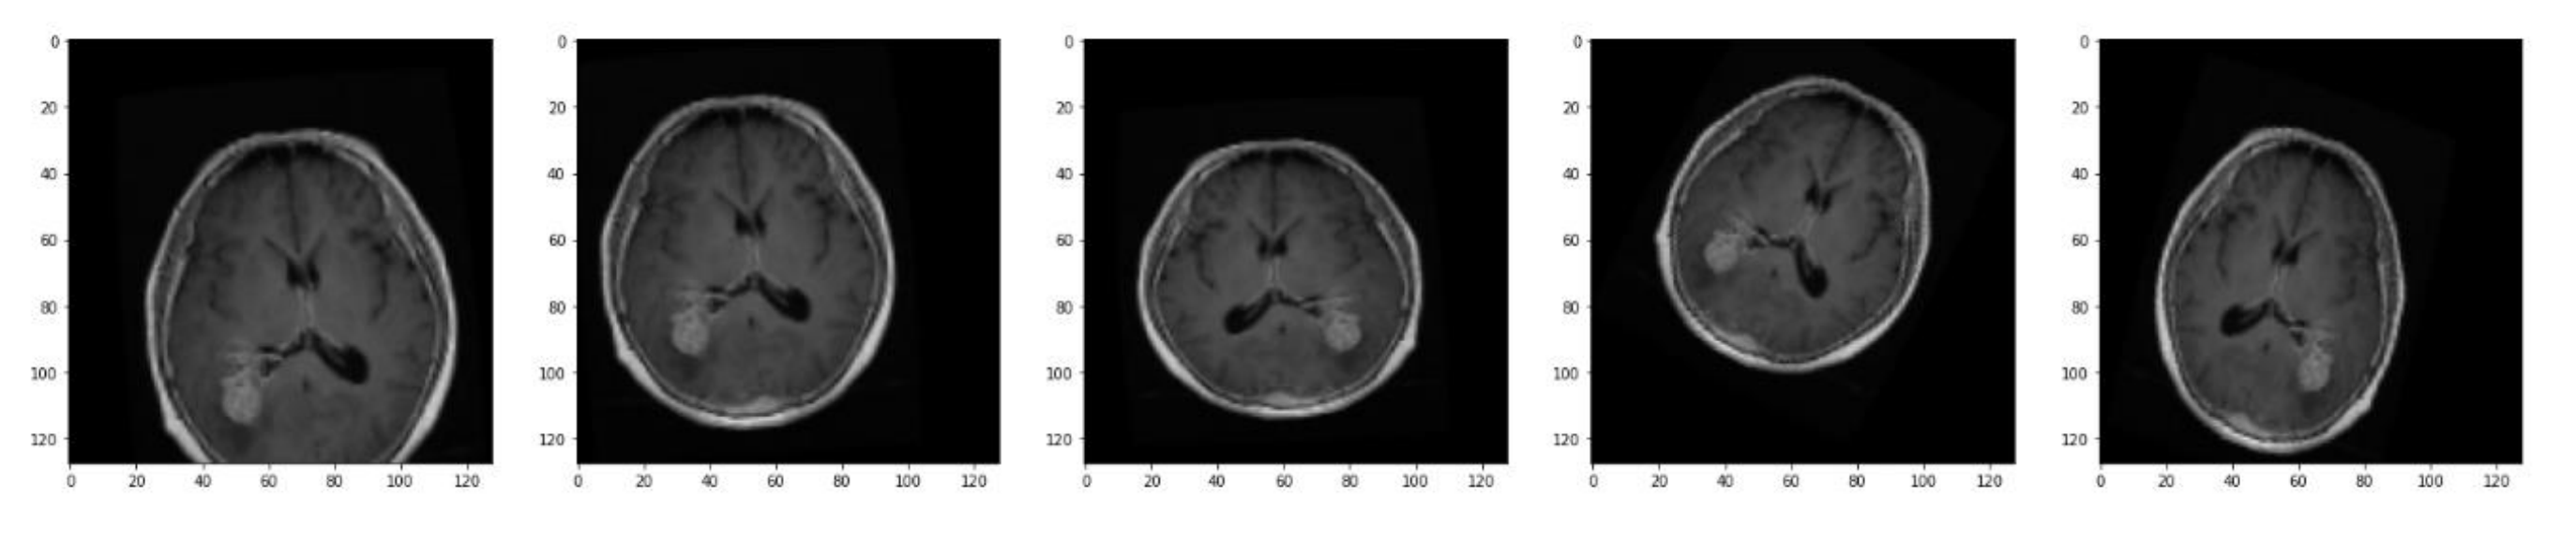
Figure 2. Result of image augmentation
Model Topology The CNN model in this study follows the proposed model in another research (Minarno, 2021). Table 1 shows the design architecture of this model.
Convolutional 2D layer consisted of filters with specific kernel size whose dimension was passed as (n, n) tuples. All convolutional layers in this model use same as its padding value to preserve the shape of the output to match the input. Maxpooling layer is utilized after every convolutional layer. It reduces the spatial dimension of its input by taking the maximum value of each window whose size was defined by pool_size. By using pool_size = (2,2), the
output shape (width and height) of this layer will be half of its input size. The output of the last Maxpooling 2D layer will be flattened into one-dimensional array in Flatten layer. The output of this layer will be received as input in a dense layer where its output shape is altered by the number of units. Dense layer performs dot product of its input along with weights to obtain the output. Furthermore, the dropout layer in this CNN model helps reduce overfitting by randomly sets input units to 0 with specific rate at each step during the training. A dense layer with softmax activation and 4 classes is used as layer to produce the final output.
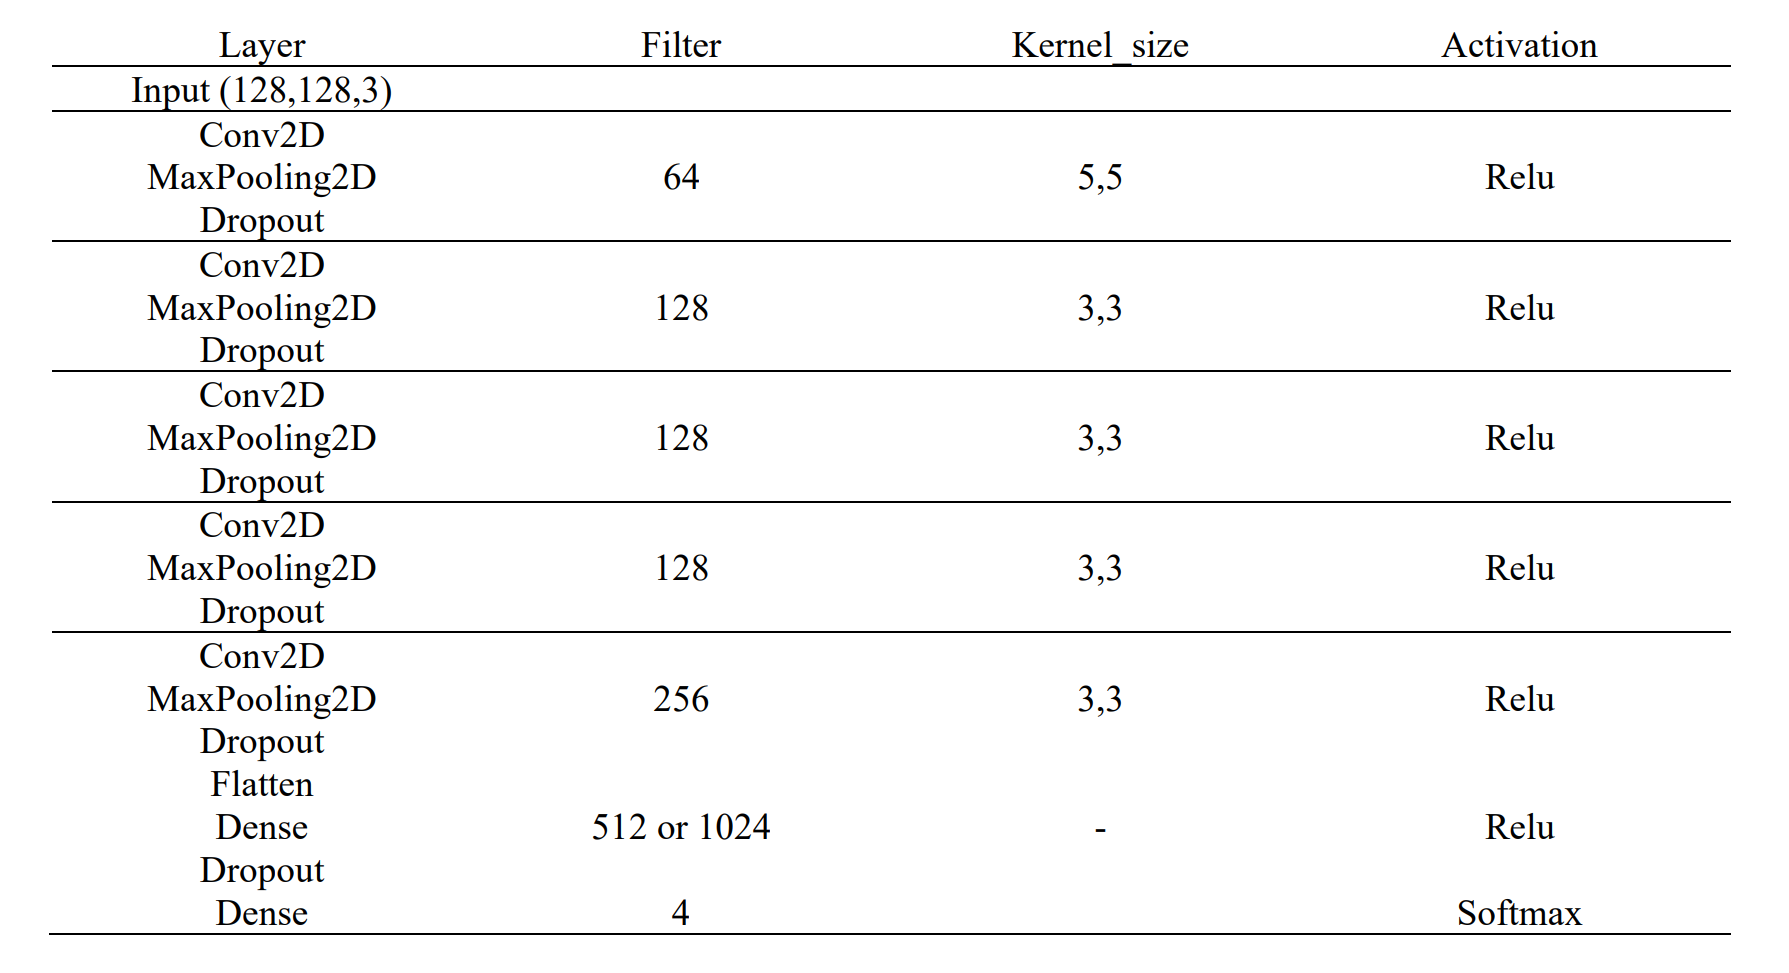
Figure 3. Model topology
Hyperparameter Tuning Hyperparameter tuning is used to find the optimal parameter for the CNN model to get the maximum result (Lee et. al., 2018). There are several parameters that can be changed and observed, such as kernel size, steps, number of channels, and the ratio of dropouts (Ranjit et. al., 2019). Table 2 shows the comparative parameters that are used.
| Parameter | Comparative Value |
|---|---|
| Optimizer | Adam, Adamax, RMSprop |
| Dense Layer | 512, 1024 |
| Dropout | 0.2, 0.5 |
Result
Several models with different combinations of parameters were trained with epoch = 5 to determine the best parameter. The result of combining the CNN model with hyperparameter tuning is shown in Table 3.
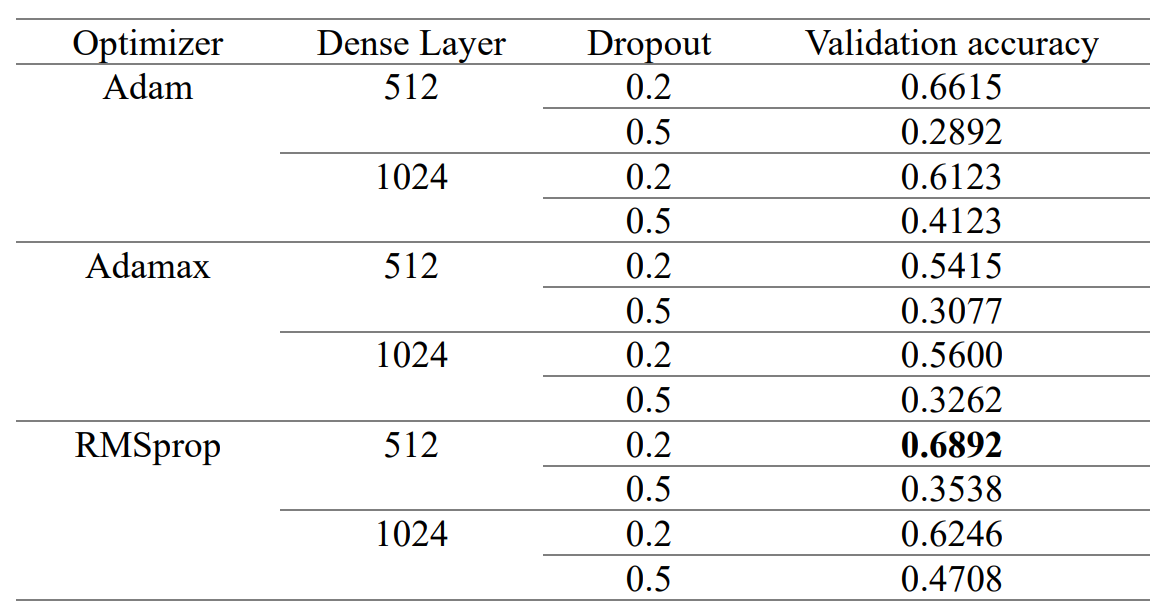
Figure 4. Result of hyperparameter tuning
Table 3 shows a general pattern where less dense layer, less dropout rate, and using RMSprop as an optimizer result in better accuracy on the validation data. Model testing was done by applying the best parameters. The train and validation accuracy and loss are visualized in Figure 5 and the model performance evaluation of the testing data can be seen in Figure 6 below. An accuracy of 91% in the testing data was obtained from this CNN model.
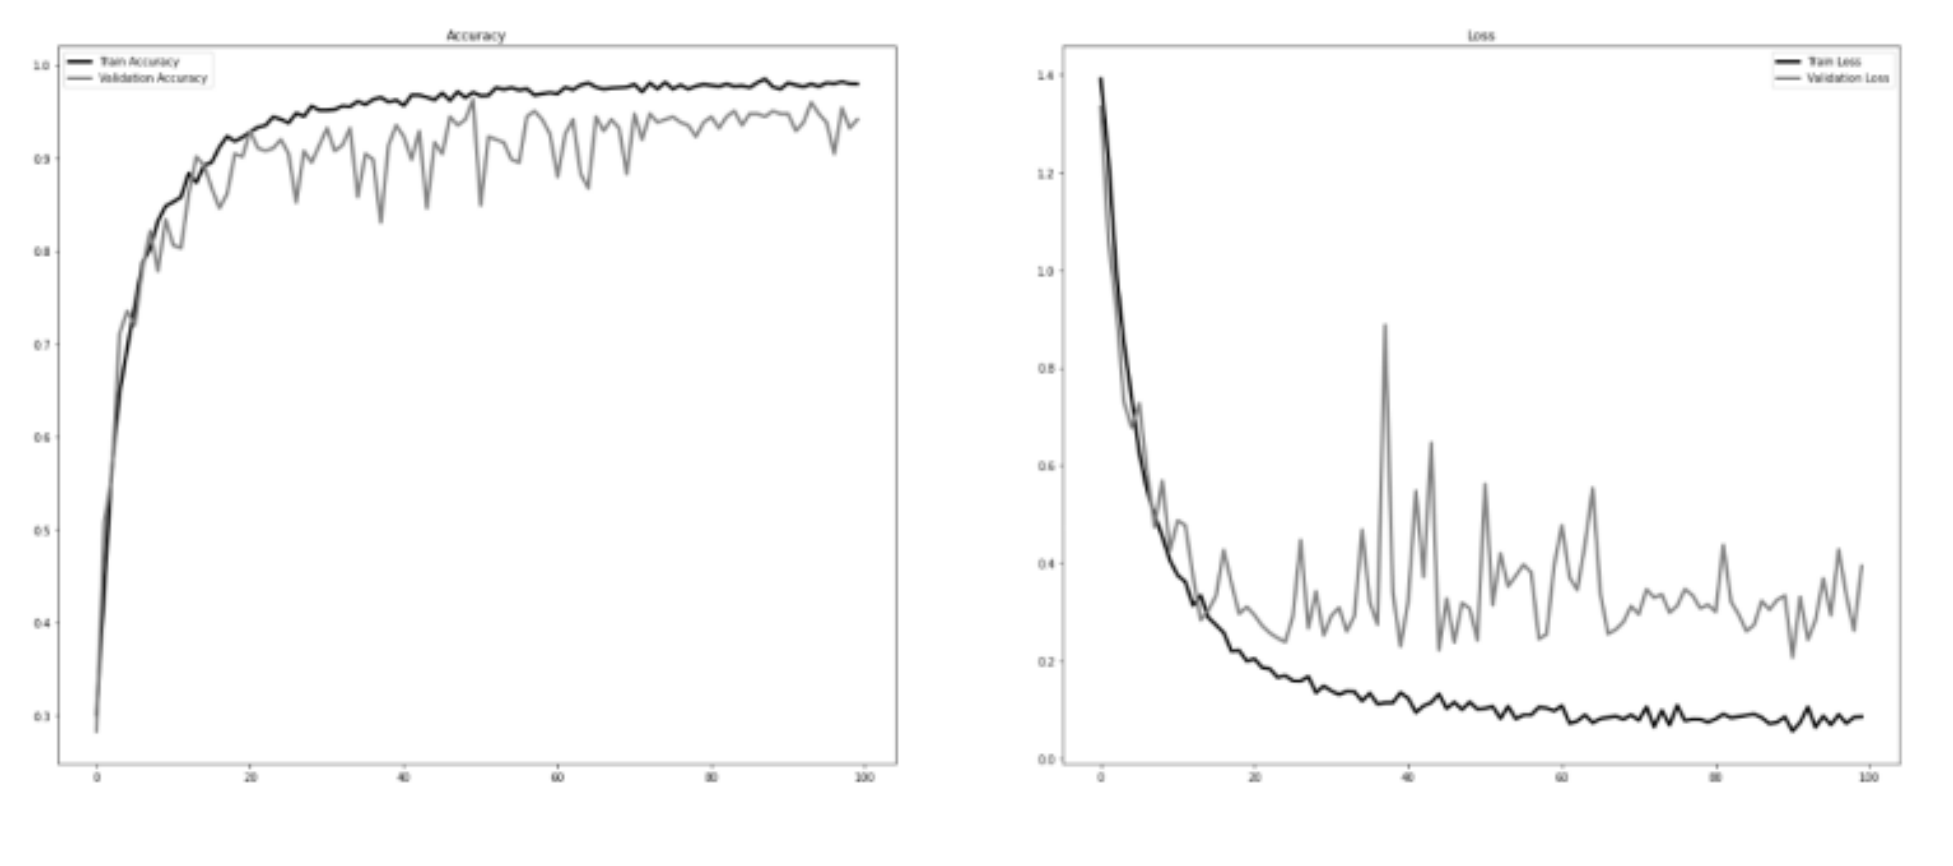
Figure 5. Accuracy and Loss
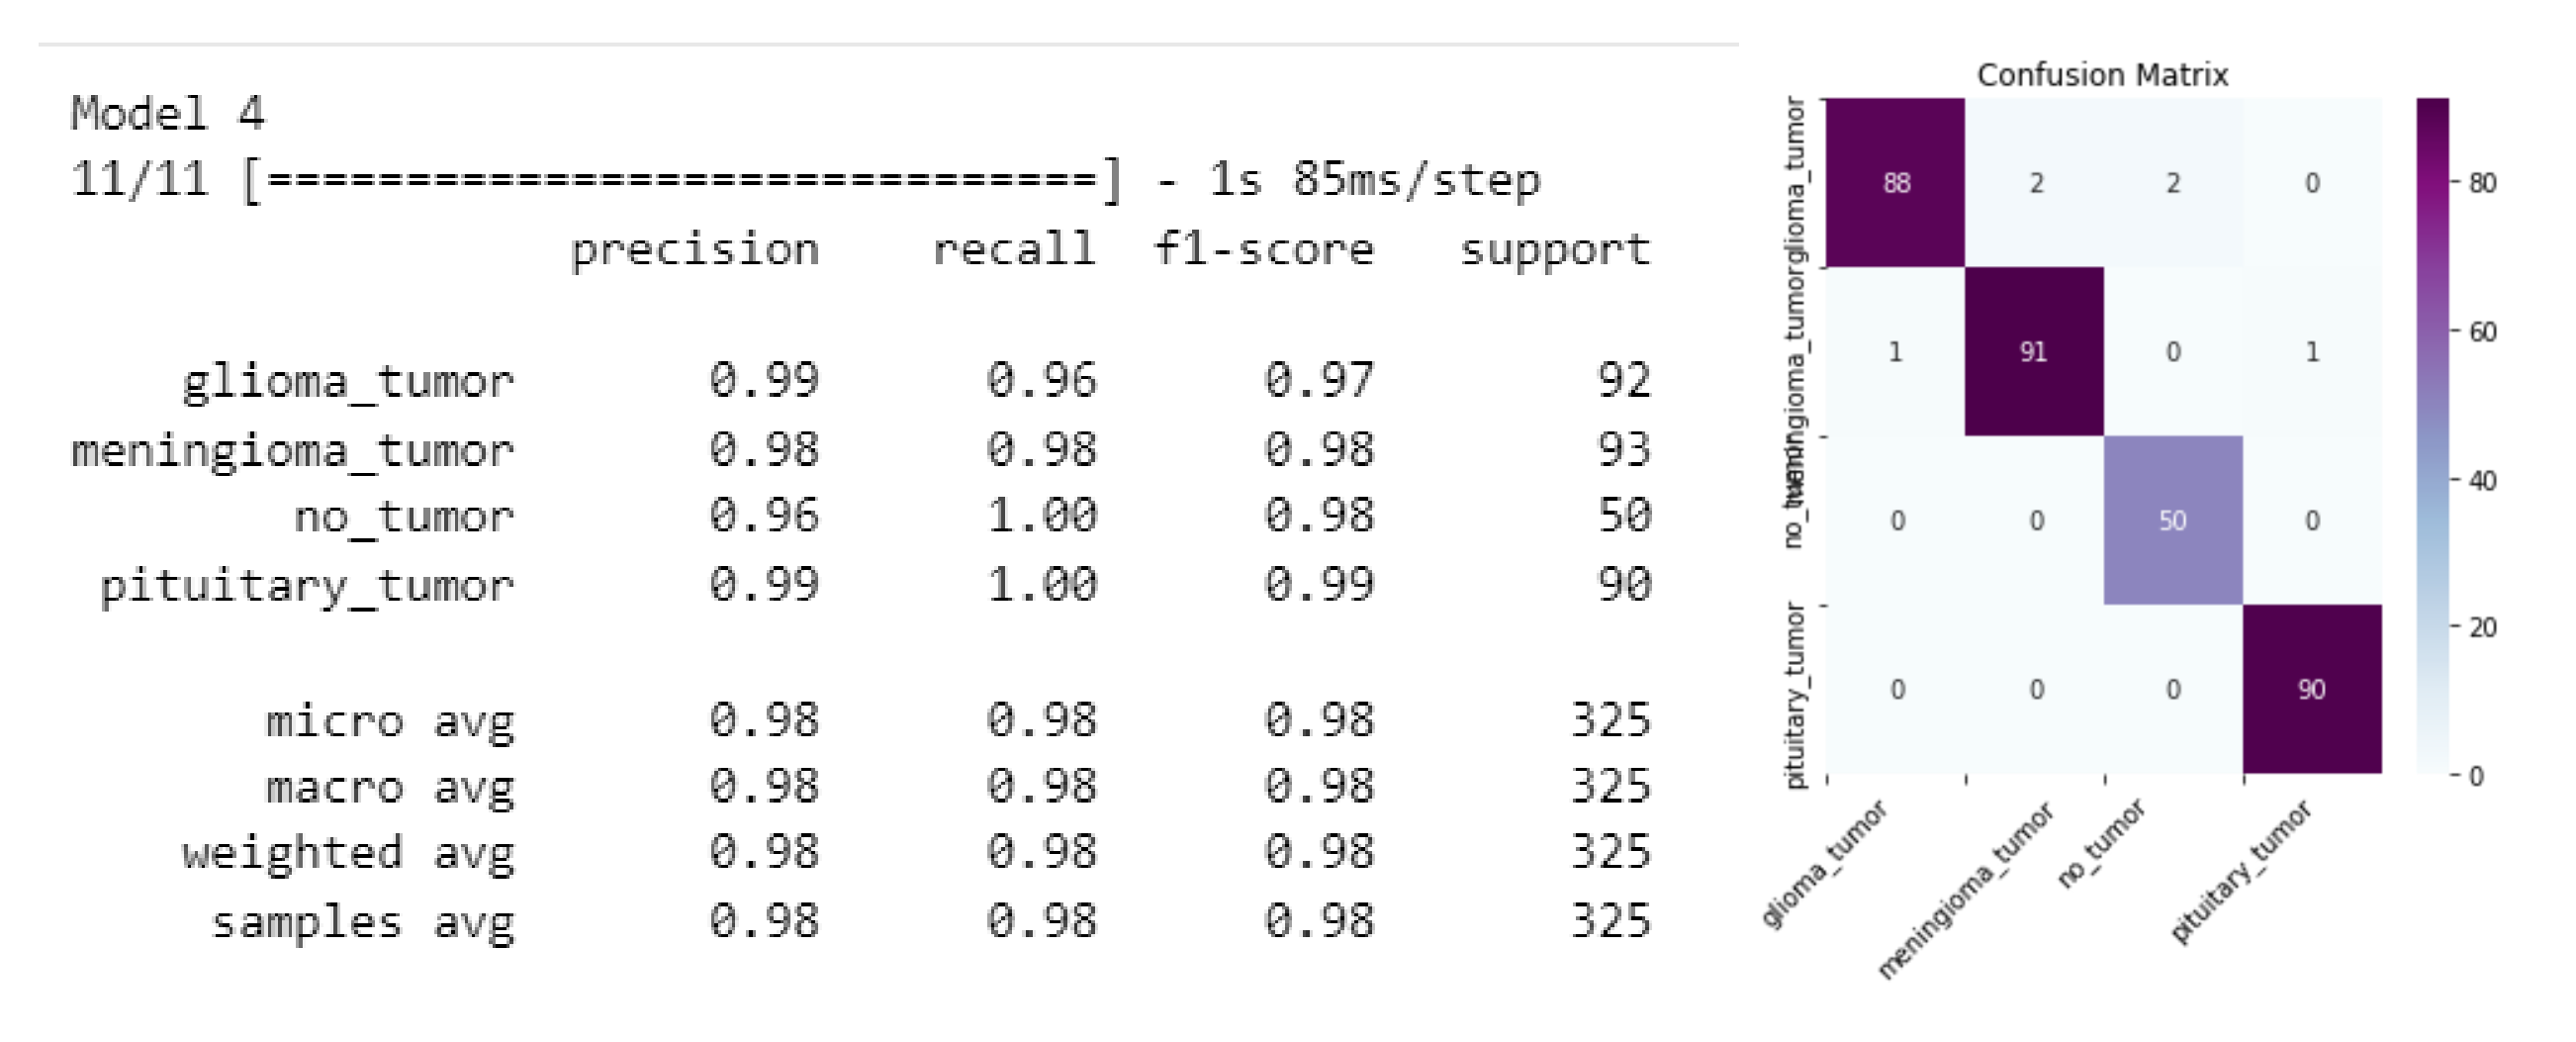
Figure 6. Model performance evaluation
Conclusion
Brain tumor classification with CNN model has an advantage in terms of time consumed to classify MRI when it is compared to manual evaluation of MRI. The proposed CNN model is combined with hyperparameter tuning to obtain the best parameter in the training. This model is able to classify MRI into four classes with an accuracy of 91% in the testing data.
References
- Ranjit, M.P., Ganapathy, G., Sridhar, K. and Arumugham, V., 2019, July. Efficient deep learning hyperparameter tuning using cloud infrastructure: Intelligent distributed hyperparameter tuning with Bayesian optimization in the cloud. In 2019 IEEE 12th international conference on cloud computing (CLOUD) (pp. 520-522). IEEE.
- Lee, W.Y., Park, S.M. and Sim, K.B., 2018. Optimal hyperparameter tuning of convolutional neural networks based on the parameter-setting-free harmony search algorithm. Optik, 172, pp.359-367.
- Minarno, A.E., Mandiri, M.H.C., Munarko, Y. and Hariyady, H., 2021. Convolutional neural network with hyperparameter tuning for brain tumor classification. Kinetik: Game Technology, Information System, Computer Network, Computing, Electronics, and Control.
- Team, K. (no date) Keras documentation: Dropout layer. Available at: https://keras.io/api/layers/regularization_layers/dropout/ (Accessed: April 15, 2023).
- Team, K. (no date a) Keras documentation: Conv2D layer. Available at: https://keras.io/api/layers/convolution_layers/convolution2d/ (Accessed: April 15, 2023).
- Team, K. (no date c) Keras documentation: MaxPooling2D layer. Available at: https://keras.io/api/layers/pooling_layers/max_pooling2d/ (Accessed: April 15, 2023).
- Ottoni, A.L.C., Novo, M.S. and Costa, D.B., 2023. Hyperparameter tuning of convolutional neural networks for building construction image classification. The Visual Computer, 39(3), pp.847-861